Make sure to stop by our booth, but also attend these two sessions!
- Wed, August 7, 10:30am PT, Common Ground. Delivered by our CTO, Mike Larkin
101 Things Your Application is Doing Without Your Knowledge
Every time you bring code you didn’t write into your application, you’re possibly introducing behavior you weren’t expecting. Even using well-known and battle-tested dependency libraries, your application might be opening files and making network connections without your knowledge. Come hear about some crazy hidden things we’ve seen applications doing, and how you can learn what yours are doing as well.
Overview:
The days of a company writing every single line of code in an application are over. Developers frequently will bring in dependency modules to fulfill non-core business tasks; for example, why write a logging subsystem from scratch when you can choose from a hundred or more drop-in implementations? Importing third-party modules comes with risk, however. How many teams take the time to review each imported module for security risks? How many teams take the time to ascertain if the module has basically correct functionality?
Analyzing a dependency’s behavior by monitoring what the application does at runtime can reveal things you may not realize are occurring. For example, we’ve witnessed a popular dashboarding/graphing component connecting to over 40 IP addresses at startup, and yet nothing in the application’s documentation mentions this behavior. We’ve also seen dependencies performing recursive readdir() operations across the entire filesystem at startup. Why would applications need to do this?
This talk will cover some of the crazy things we’ve seen applications doing and how we came to be aware they were doing these things. We’ll talk about tools you can use to learn what your applications are doing behind the scenes, too.
Takeaways:
At the end of this talk, the audience will have a better understanding of the types of “hidden” behavior that applications commonly exhibit, how to discover which of these behaviors are present, and how to find the module/dependency causing the behavior.
Outline:
- Examples of third-party code modules that can easily and covertly introduce risk into an app
- Why it’s important to review each imported module for risks and ascertain if each module has basically correct functionality.
- What is runtime analysis and why is it important?
- Real-world examples of the crazy things we’ve seen applications doing and how we only became aware during runtime. For example::
- A popular dashboarding/graphing component is connecting to over 40 IP addresses at startup, and yet nothing in the application’s documentation mentions this behavior.
- Dependencies performing recursive readdir() operations across the entire filesystem at startup. Why would applications need to do this?
2. Wed August 7, 3pm PT, Training Ground. Delivered by our CTO, Mike Larkin and VP of Engineering, Rizwan Merchant
Workshop: Vulnerability Reachability Analysis Using OSS Tools
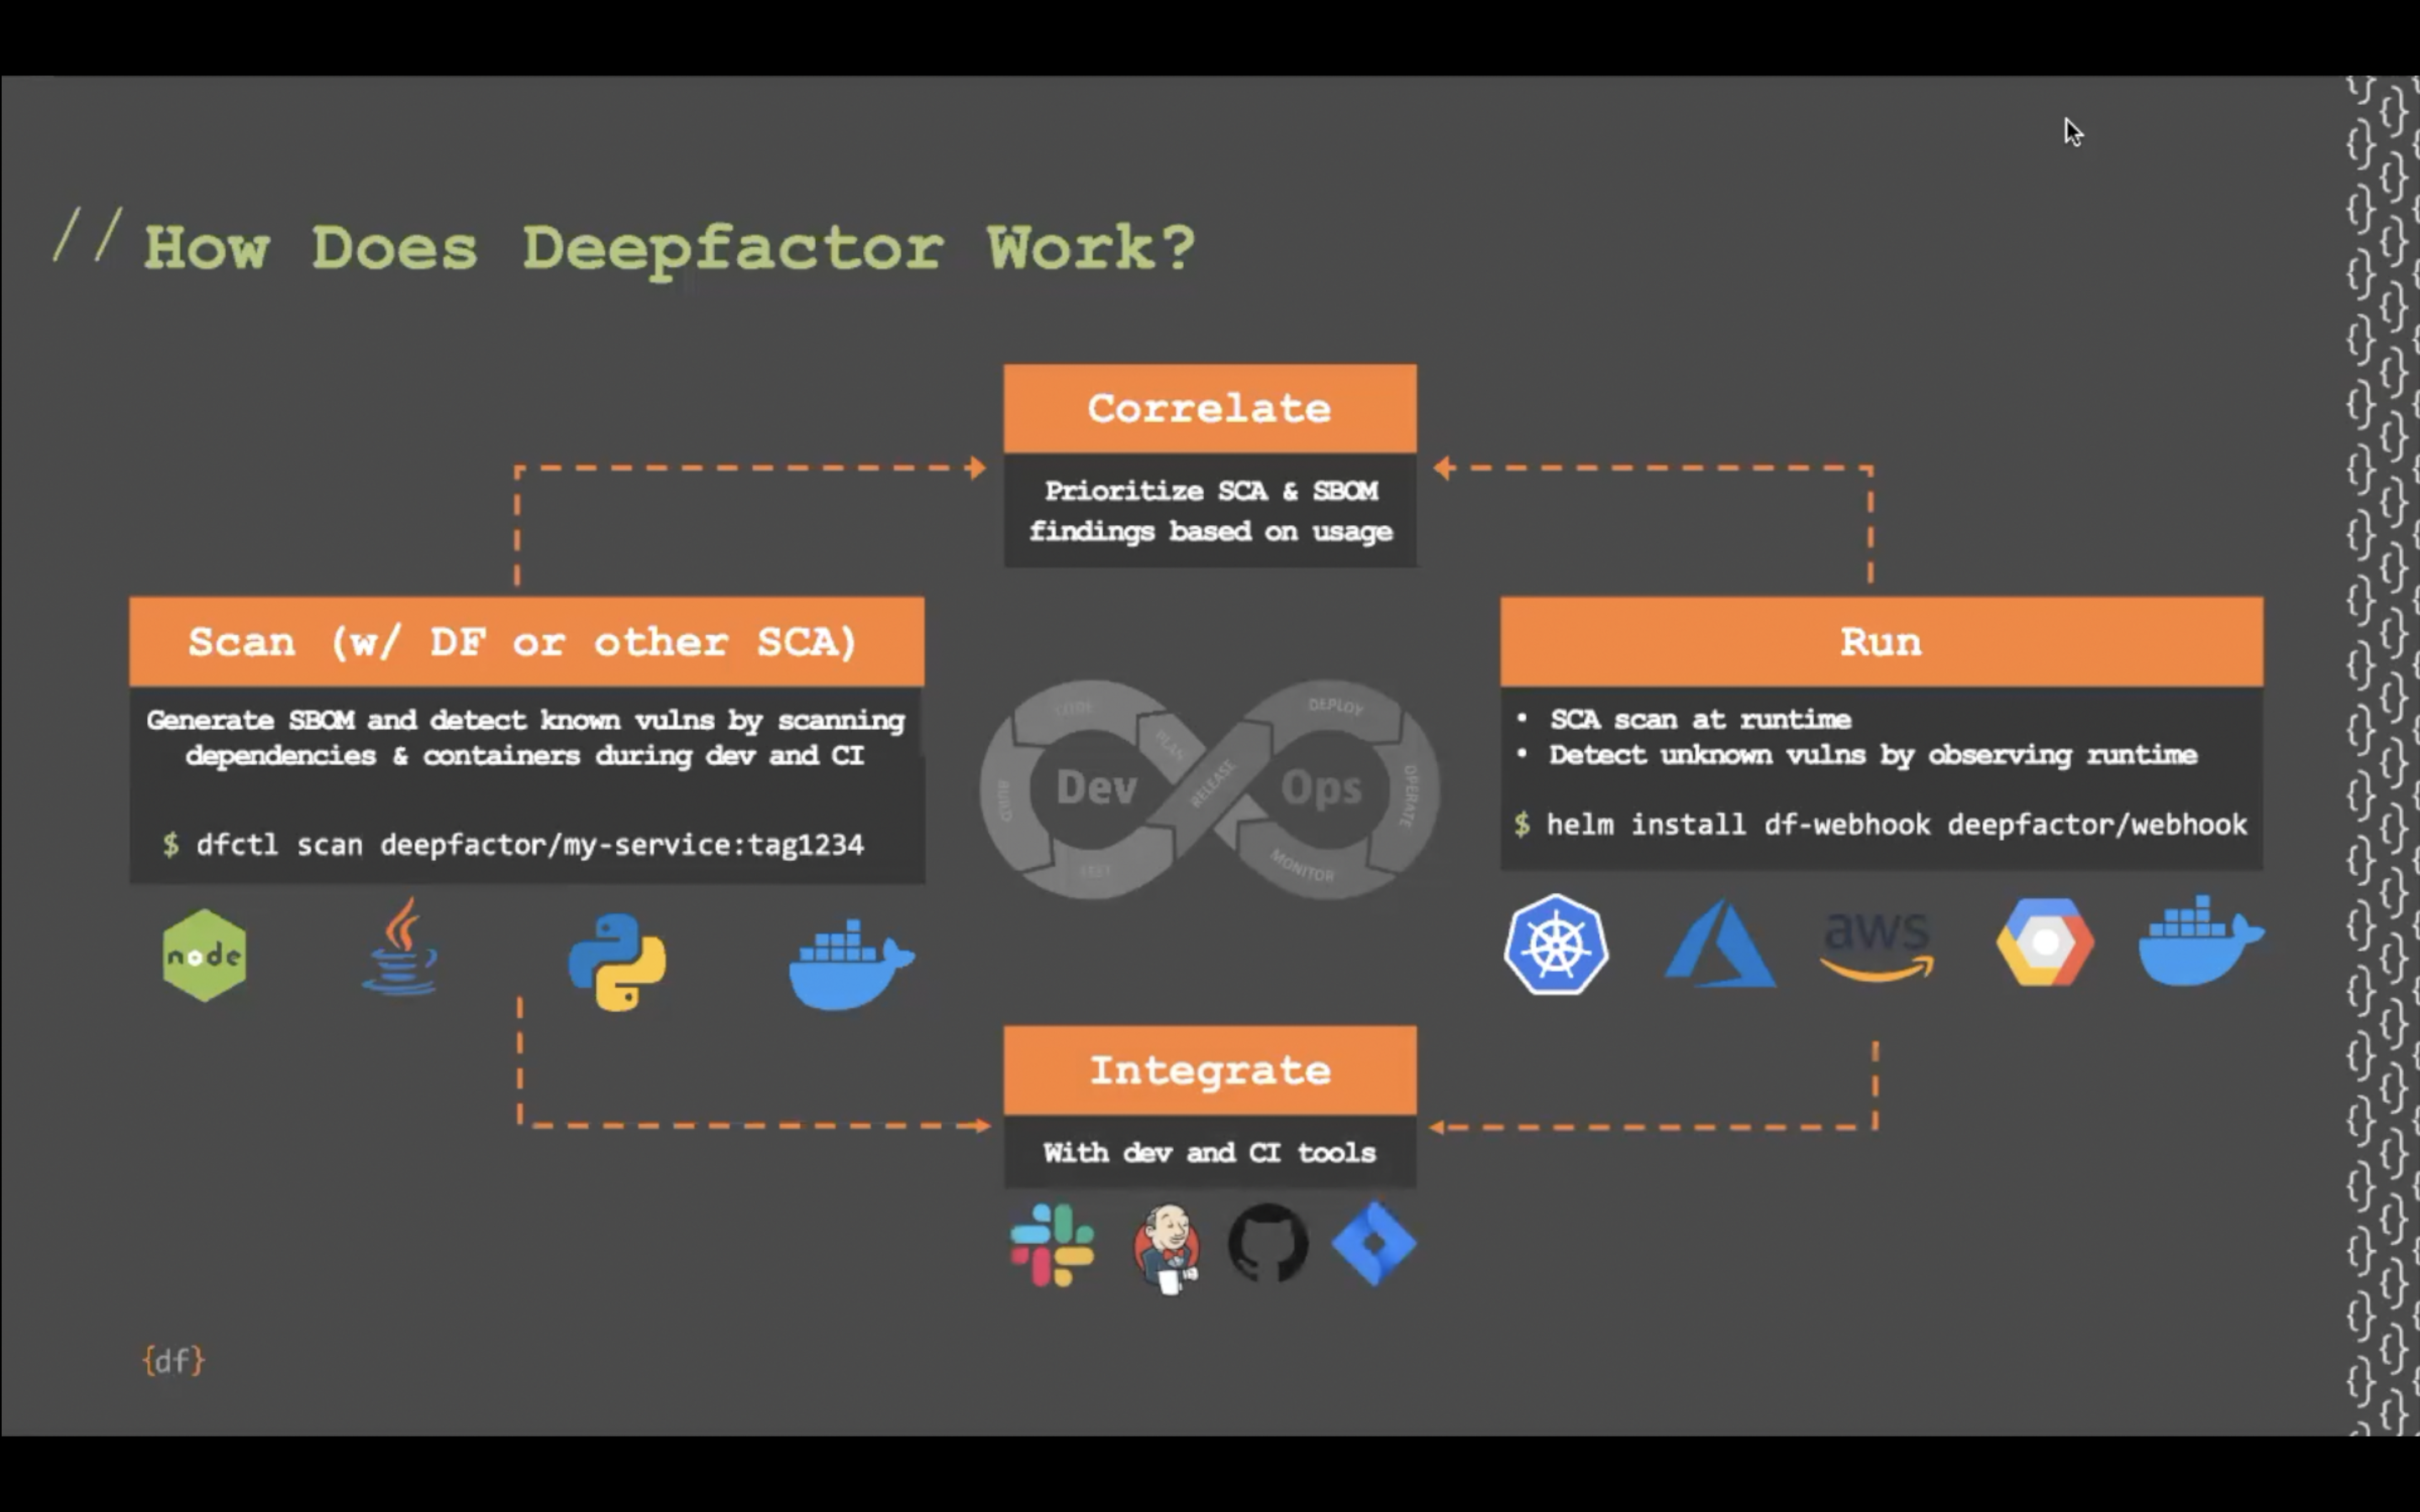
New vulnerabilities are disclosed every day in dependencies that you or your team may be using. But how do you know if you are actually using the vulnerable code? This workshop will show you how to use two different types of tools to analyze reachability (1) static call graphs and (2) runtime analysis, and help in deciding if the vulnerability needs to be prioritized based on your own code usage.
Workshop Overview:
The workshop will be broken into several modules; introductory modules will cover the workshop organization and administrative matters (installing and configuring the tools used in the workshop). Subsequent modules will give an outline of what vulnerability reachability is and why it is important and compare/contrast the two main ways of understanding reachability (static call graphs and runtime analysis).
Next, the workshop will present two short exercises, intended for the attendees to gain hands-on experience using both types of tools against real applications with real vulnerabilities. Interpreted languages (Java) and compiled languages (C/C++/Go) will be covered. Subsequently, the following module will walk through how to interpret the results obtained from the exercises and draw conclusions. The languages chosen are merely representative; the skills learned in the workshop are equally applicable to other languages.
The workshop will conclude with two modules which will present a short overview of commercial tools and a conclusion/wrap-up/Q&A session.
Workshop Outline:
I. Overview (10 minutes)
- A. Workshop organization
- B. About the tools and sample applications
- 1. What are the tools and applications we are going to use?
- C. Obtaining/installing the tools and sample applications
- 1. Cloning from the github repo
- D. Goals of the workshop (what you will learn)
- 1. Be able to understand the importance of vulnerability reachability and how it helps prioritize remediation strategy
- 2. Become familiar with some of the tools available to help with vulnerability reachability
- 3. Learn where you can reach out to for more help in these areas after the completion of the workshop
II. Types of reachability analysis (10 minutes)
- A. Static analysis / call graphs
- 1. What is a call graph?
- 2. What information does a call graph provide to you
- B. Runtime analysis
- C. Language and environment considerations
- 1. Things to consider when choosing a reachability analysis solution
- a. Types of applications being analyzed (COTS vs self-written)
- b. Availability of source code
- c. Robustness of test environment
- 1. Things to consider when choosing a reachability analysis solution
III. Static call graph analysis exercise (20 minutes)
- A. Using static call graph analysis in IntelliJ/Eclipse to analyze a Java application
- B. Using Go callgraph to analyze a Go application
- C. How to correlate a call graph with an SBOM
IV. Dynamic/runtime analysis exercise (20 minutes)
- A. Using a Java agent to analyze runtime reachability in a running Java application
- B. Using valgrind/KCacheGrind to analyze a running C/C++ application
- C. How to correlate runtime analysis with an SBOM
V. Results comparison (10 minutes)
- A. Using the results of each exercise to determine if vulnerable code was used
- 1. How to use the output of each tool to understand what vulnerabilities need to be prioritized
- B. Benefits and limitations of each approach
VI. Conclusion and Q&A (20 minutes)
Outcome/Learnings
- Understand what vulnerability reachability is and why it is important
- Compare/contrast the two main ways of understanding reachability (static call graphs and runtime analysis)
- Via hands-on experience, use both types of tools against real applications with real vulnerabilities. Interpreted languages (Java) and compiled languages (C/C++/Go) will be covered.
- Learn how to interpret the results obtained from the exercises and draw conclusions
If you would like to meet with us, you can schedule a time here.

